| What you put in... | What you get out... |
|
|
The Customer Choice (Logit) model is an individual-level response model that helps to analyze and explain the choices individual customers make in the market. The Customer Choice model helps firms to understand the extent to which such factors as price of a brand or its ease of installation influence a customer's choice of a brand. A brand's purchase probability at the individual level is equivalent to the brand's market share at the market level.
Firms can use Customer Choice analysis to develop marketing programs that are tailored to specific market segments, or even tailored to individual customers.
This model uses the following input:
- Single Alternative/Boolean
This method analyzes only one option instead of choosing one among several alternatives. For this analysis, only one brand's data is required. - Multiple Alternatives
This method considers customer response across a subset of related competitors. For this analysis, the following data is required for all competing brands involved in the study.
For each customer, the data that goes into this model is a set of ratings on various attributes of each alternative (either single alternative "yes/no" response, or multiple alternatives "chose one of N" response) involved in the study, and the alternative that the customer chose in each period. For the "Single Alternative/Boolean" option, this would be a 1 or 0, depending on whether or not the customer chose this alternative. For the "Multiple Alternatives" option, one alternative would be a 1 to indicate the alternative chosen during this period, while the others remain 0 to indicate that this particular customer did not choose the other alternatives.

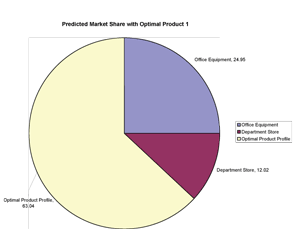
 The Conjoint Analysis model is widely employed for designing new products. It is a procedure for measuring, analyzing, and predicting customers' responses to new products and to new features of existing products. It enables companies to decompose customers' preferences for products and services (provided as descriptions or visual images) into "part-worth" utilities associated with each option of each attribute or feature of the product. Firms can then recombine the part-worths to predict customers' preferences for any possible combination of attribute options. Firms can use conjoint analysis to:
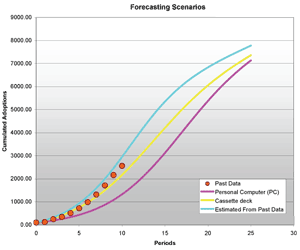
 The Marketing Engineering for Excel software includes both the Bass model and the Generalized Bass model. The Bass model assumes that the sales rate for the product is not affected by marketing mix variables while the Generalized Bass model assumes that the product sales rate in the target segment is affected by the level of advertising for the new product, and by the price of the new product.